
CASE STUDY

Arizona Media Institute
Here's the thing nobody in the trust-in-media conversation says out loud: almost everyone quoting the numbers is quoting somebody else's. The surveys get produced by trade groups with a stake in the answer, then cited downstream as fact by people who never checked.
You can build a real organization on borrowed numbers. Plenty do. But you can't prove you changed anything, and you can't stop a competitor from standing on the exact same data you are.
That's the choice the Arizona Media Institute was facing, three months out from launch.
TL;DR
CLIENT
Arizona Media Institute (AZMI), a new initiative of the Center for the Future of Arizona — a nonpartisan nonprofit backing fact-based journalism statewide
SITUATION
A brand new initiative preparing to launch with ambitious long-term goals that were genuinely difficult to measure. Multiple stakeholders. No existing measurement infrastructure. A leadership team that needed measurement built into the foundation before the institute went live.
THE WORK
A measurement framework built before launch across what Arizonans think, the health of Arizona media, and whether AZMI's programs land
THE SHIFT
From citing the industry's borrowed numbers to owning original Arizona data nobody else can produce
THE OUTCOME
One definition of success every stakeholder signed off on, plus a three-year data asset that compounds
The Challenge
AZMI was set up to do something genuinely hard to prove: make journalism better, rebuild public trust in it, and strengthen civic life across Arizona. They weren't starting from nothing — the Center for the Future of Arizona had years of data on what Arizonans care about, plus real partnerships and a million-dollar founding gift.
But look at who was in the room. A CEO. An executive vice president. An advisory council being assembled. A funder expecting evidence. Each one carrying a different picture of what a win looked like. That's the part that keeps a director up at night — not "will the programs work," but "which version of success am I being measured against, and what happens when I pick wrong in front of the person who wrote the check?"
Every week closer to launch was a week those definitions hardened into assumptions nobody would revisit. And there was no baseline — whatever they didn't capture before launch was gone permanently.
You can't show change from a starting point you never wrote down.
The Shift
"I want to make sure that we have this framework and measurement in place from the get-go. Whatever we want to measure needs to be part of the foundation of how we're building things." — Director, Arizona Media Institute
Most teams bolt measurement on after the fact. Do the work, generate activity, then reverse-engineer a story about impact. It never holds, because you skipped the part where you decided what impact meant. Their director refused to do it that way, and that instinct alone put AZMI ahead of the field.
The bigger shift came from reviewing what already existed. Nearly every trust-in-media survey being cited was produced by trade groups reporting on their own industry. Everyone quoted it. Nobody questioned it. Which meant if AZMI collected this themselves — independent, nonpartisan, Arizona-specific, repeated the same way for three straight years — they wouldn't just have better numbers. They'd have the only numbers.
The Work
Built with AZMI's team rather than handed to them, and designed to be pressure-tested with advisors before anything went live. We started by auditing what CFA already owned — the Gallup Arizona Survey, the Progress Meters, the Voters' Agenda, plus national data on local journalism health.
That last one reframed the project: CFA already knew what Arizonans say matters to them, so "quality journalism" stopped being a philosophical debate and became something countable.
Phase 1
Started With What They Already Owned
The hardest one. You're measuring how a whole state feels about its media in a way that still means something three years out. Two approaches running together: first-party surveys for attitudes, and tracking how conversation around the priority topics moves over time. The governing rule was consistency — same questions, same way, every year, so year three can be honestly compared to year one.
- Survey covering trust in local media, engagement with journalism, and access to coverage by region
- Deliberate rural oversampling — the gap existing surveys leave wide open
- Topic conversation tracking to show whether coverage of priority issues is growing or shrinking
- Question design built to surface real attitudes instead of reflexive answers
- Baseline methodology plus the year-over-year comparison rules
Phase 2
Made Media Health Quantifiable
Counting stories is easy and nearly useless on its own. Volume tells you something got published; it says nothing about whether it was accurate, fact-based, or connected to what Arizonans care about. So the framework tracks capacity and quality as separate things, with a scoring approach applied identically every cycle. Anyone can count outlets. Nobody else will have three years of consistently scored Arizona coverage.
- Capacity indicators: outlet counts, geographic coverage including rural, journalist staffing, sustainability
- Topic coverage volume tied to the priorities Arizonans already confirmed in CFA data
- Quality scoring against fixed criteria — fact-based, accurate, on priority topics, reaching past metro
- Third-party sources mapped alongside AZMI's own monitoring so the picture doesn't depend on one feed
Phase 3
Wired the Programs to Report on Themselves
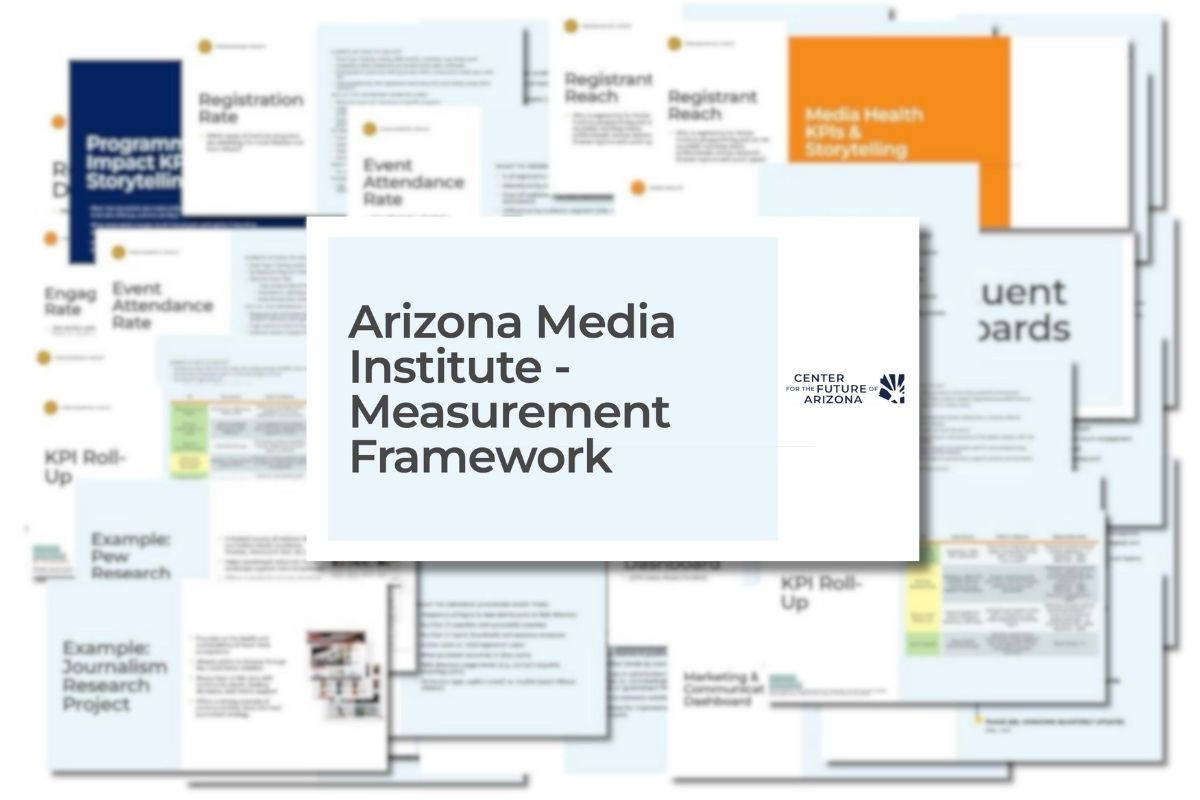
AZMI was launching three things: a data library, an events function, and an expert database journalists could pull from. Each needed different tracking, and all of it had to be trackable from day one rather than retrofitted. The dashboard ranks KPIs by priority, which kept the team honest about what was measurable at launch versus what needed building first.
- Data library: access frequency, which topics get pulled, by which outlets and from where
- Events: registration versus actual attendance, post-event feedback, repeat engagement over time
- Expert database: logins, how experts get referenced in published stories, and the reach of that coverage
- Salesforce tying engagement together across touchpoints, from email opens to program participation
- Monthly dashboard with KPIs ranked by priority
Phase 4
Set the Three-Year Cadence
Different questions answer on different clocks, and mixing them is how measurement programs quietly die. Programming reports monthly because it's operational and fixable.
Sentiment and media health report annually against a three-year arc, because that's the honest timeframe for the kind of change AZMI exists to make. Advisor input got scheduled to specific decision points instead of whenever someone asked.
- Monthly: programming dashboard
- Annual and three-year: public sentiment and media health, methodology locked so the comparison holds
- Advisory engagement mapped by timing, format, and scope at each stage
- Phase 2 handoff defining exactly which baseline assessments run once the framework was live
The Outcome
The debates stopped before they started. Leadership, the advisory council, and the funder all point to the same document when they talk about success—not because anyone was talked into anything, but because the framework replaced four opinions with one agreed set of numbers.
Instead of spending meetings arguing about whether the data was valid, the team focuses on what to adjust, how to position the outcomes, and how to extend the work. Their director could walk into a room with leadership and a founding funder and say what AZMI was tracking, how, and when they'd know. No assumptions.
And underneath it, the asset. Every survey cycle and every quality score makes AZMI's position harder to challenge and harder to duplicate. Three years in, they won't be citing the trade groups. The trade groups will be citing them.
The Takeaway
WHO'S STUCK HERE
Teams where leadership, the board, and the funders each hold a different version of success — so every recommendation is a coin flip, and you're the one blamed for the toss.
FOR OTHER ORGANIZATIONS
The document that gets your stakeholders on the same page and the data that makes you hard to replace are the same document. Build it before you launch, or spend three years explaining why you can't prove anything.
WHAT THIS CASE PROVES
Competitors copy programs, messaging, and positioning in weeks. They can't copy data that came from your own audience. Everyone in your category is citing the same borrowed numbers. Go get your own.
Your team can't get behind a number nobody trusts.
Every meeting spent arguing whether the data is real is a meeting nobody spent deciding what to do about it. We'll show you where your numbers are really coming from, which metrics translate into actionable KPIs — and what it takes to own them.